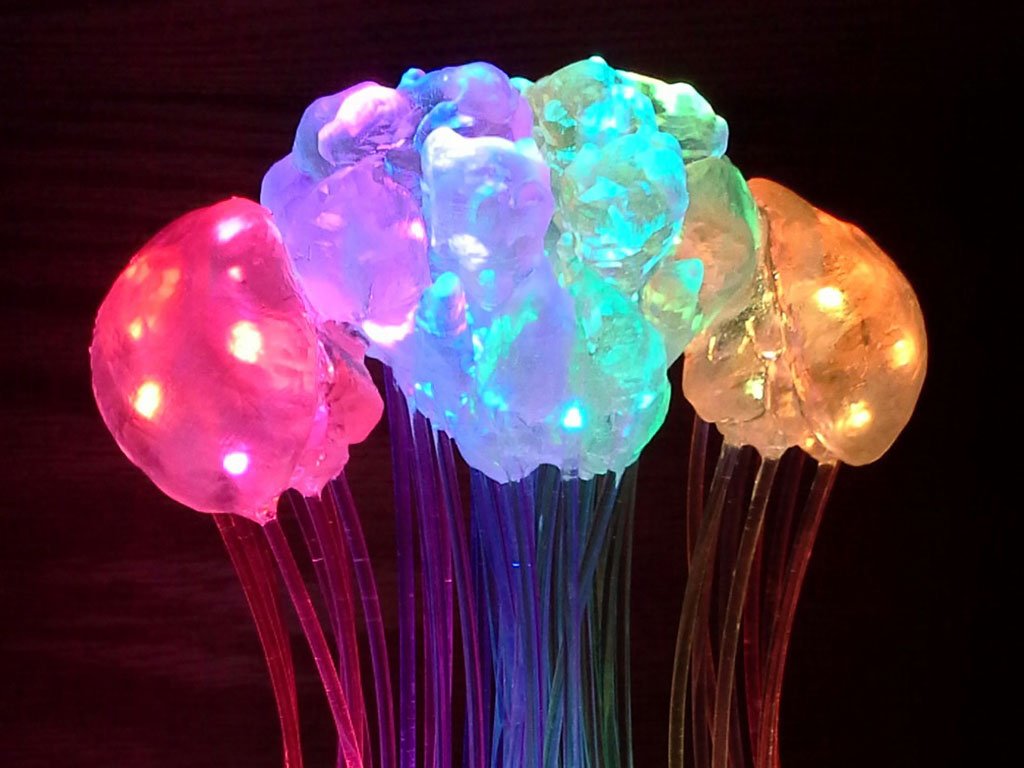
Light display in a 3D-printed model
13 October 2014
As part of her research at the Kavli Institute for Brain and Mind at UC San Diego, in the research laboratory of Prof. Ralph Greenspan, my sister uses advanced microscopy techniques to observe the activity of the brain of the fruit fly (Drosophila Melanogaster) in three dimensions. 3D data isn't trivial to display on a conventional 2D screen like a computer monitor, so I started thinking about ways to show it on a real model.
At the same time, the MIT department where I currently do research (Materials Science and Engineering) acquired a Formlabs 3D printer, which has a great print resolution and allows to make models in a transparent resin. After several design iterations, I decided to use optical fibers to light up a 3D printed model in specific locations.
For those who want to use similar ideas with their own 3d models, I wrote step-by-step instructions on how to build such a display. They're available on Instructables.
I downloaded a 3D model of the brain of the fruit fly on the website of the FlyBrain project, which was built from fluorescence data measured on an actual fly. They then labelled and delimited the different regions BY HAND ! Kudos to the authors. A little bit of cleanup on the meshes (especially to remove inner voids) allowed me to join them together to get a printable stl. I uploaded the cleaned-up file on my thingiverse repository.
The harder part was to determine where to place the ends of the optical fibers. The goal being to be able to illuminate specific locations of the model without having light sources too close to the surface, which would show up very bright compared to the rest. I ended up generating a grid of regularly-spaced spheres covering the whole volume of the model, and deleted all of those that were not entirely contained inside the model mesh. 53 spheres remained, which would later correspond to the total number of fibers needed to illuminate the whole model relatively homogeneously.
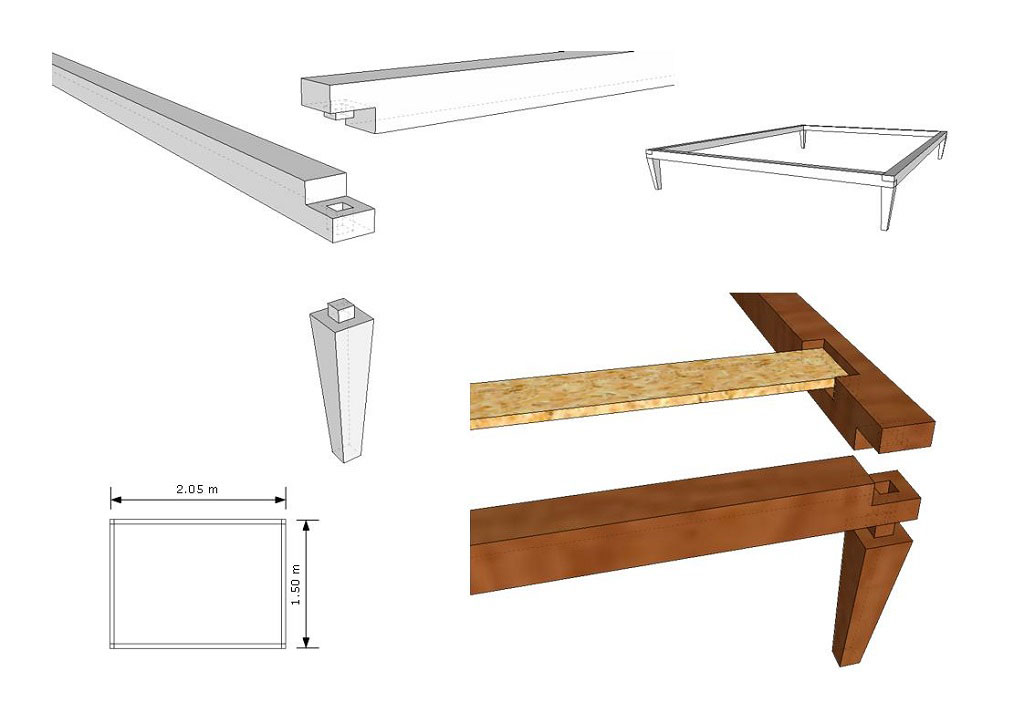
Cylinders with diameter 2mm were then generated from the center of each sphere, and subtracted from the brain model to create the guides where the fibers would be inserted after printing. Below is a little video showing this process.
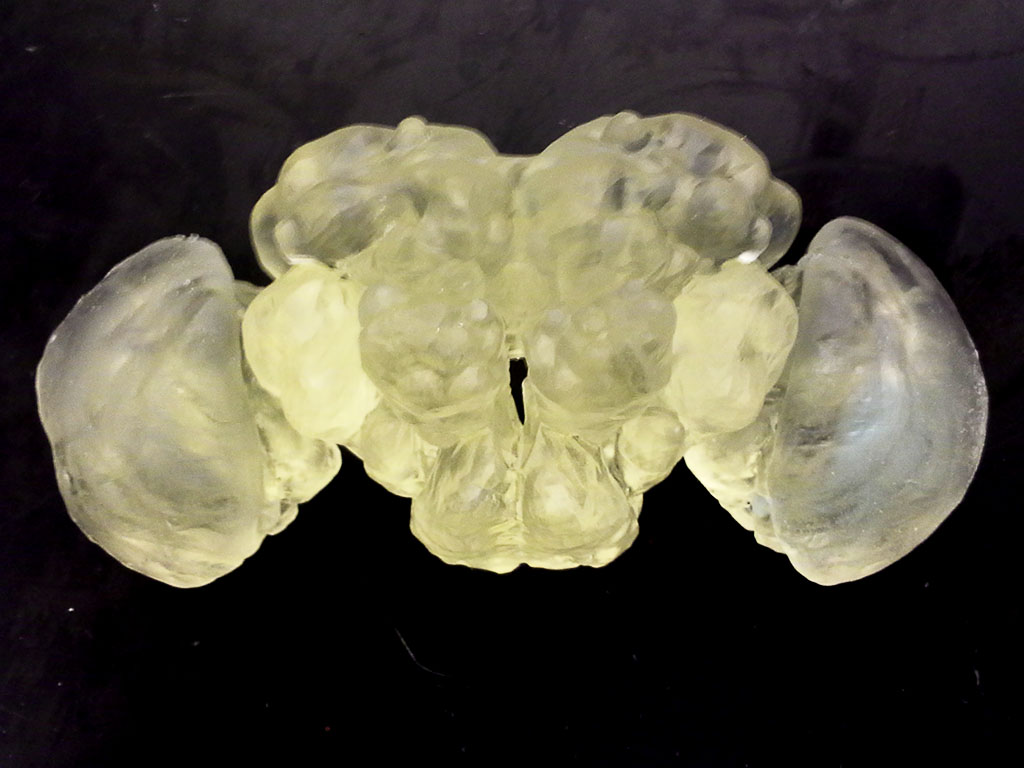
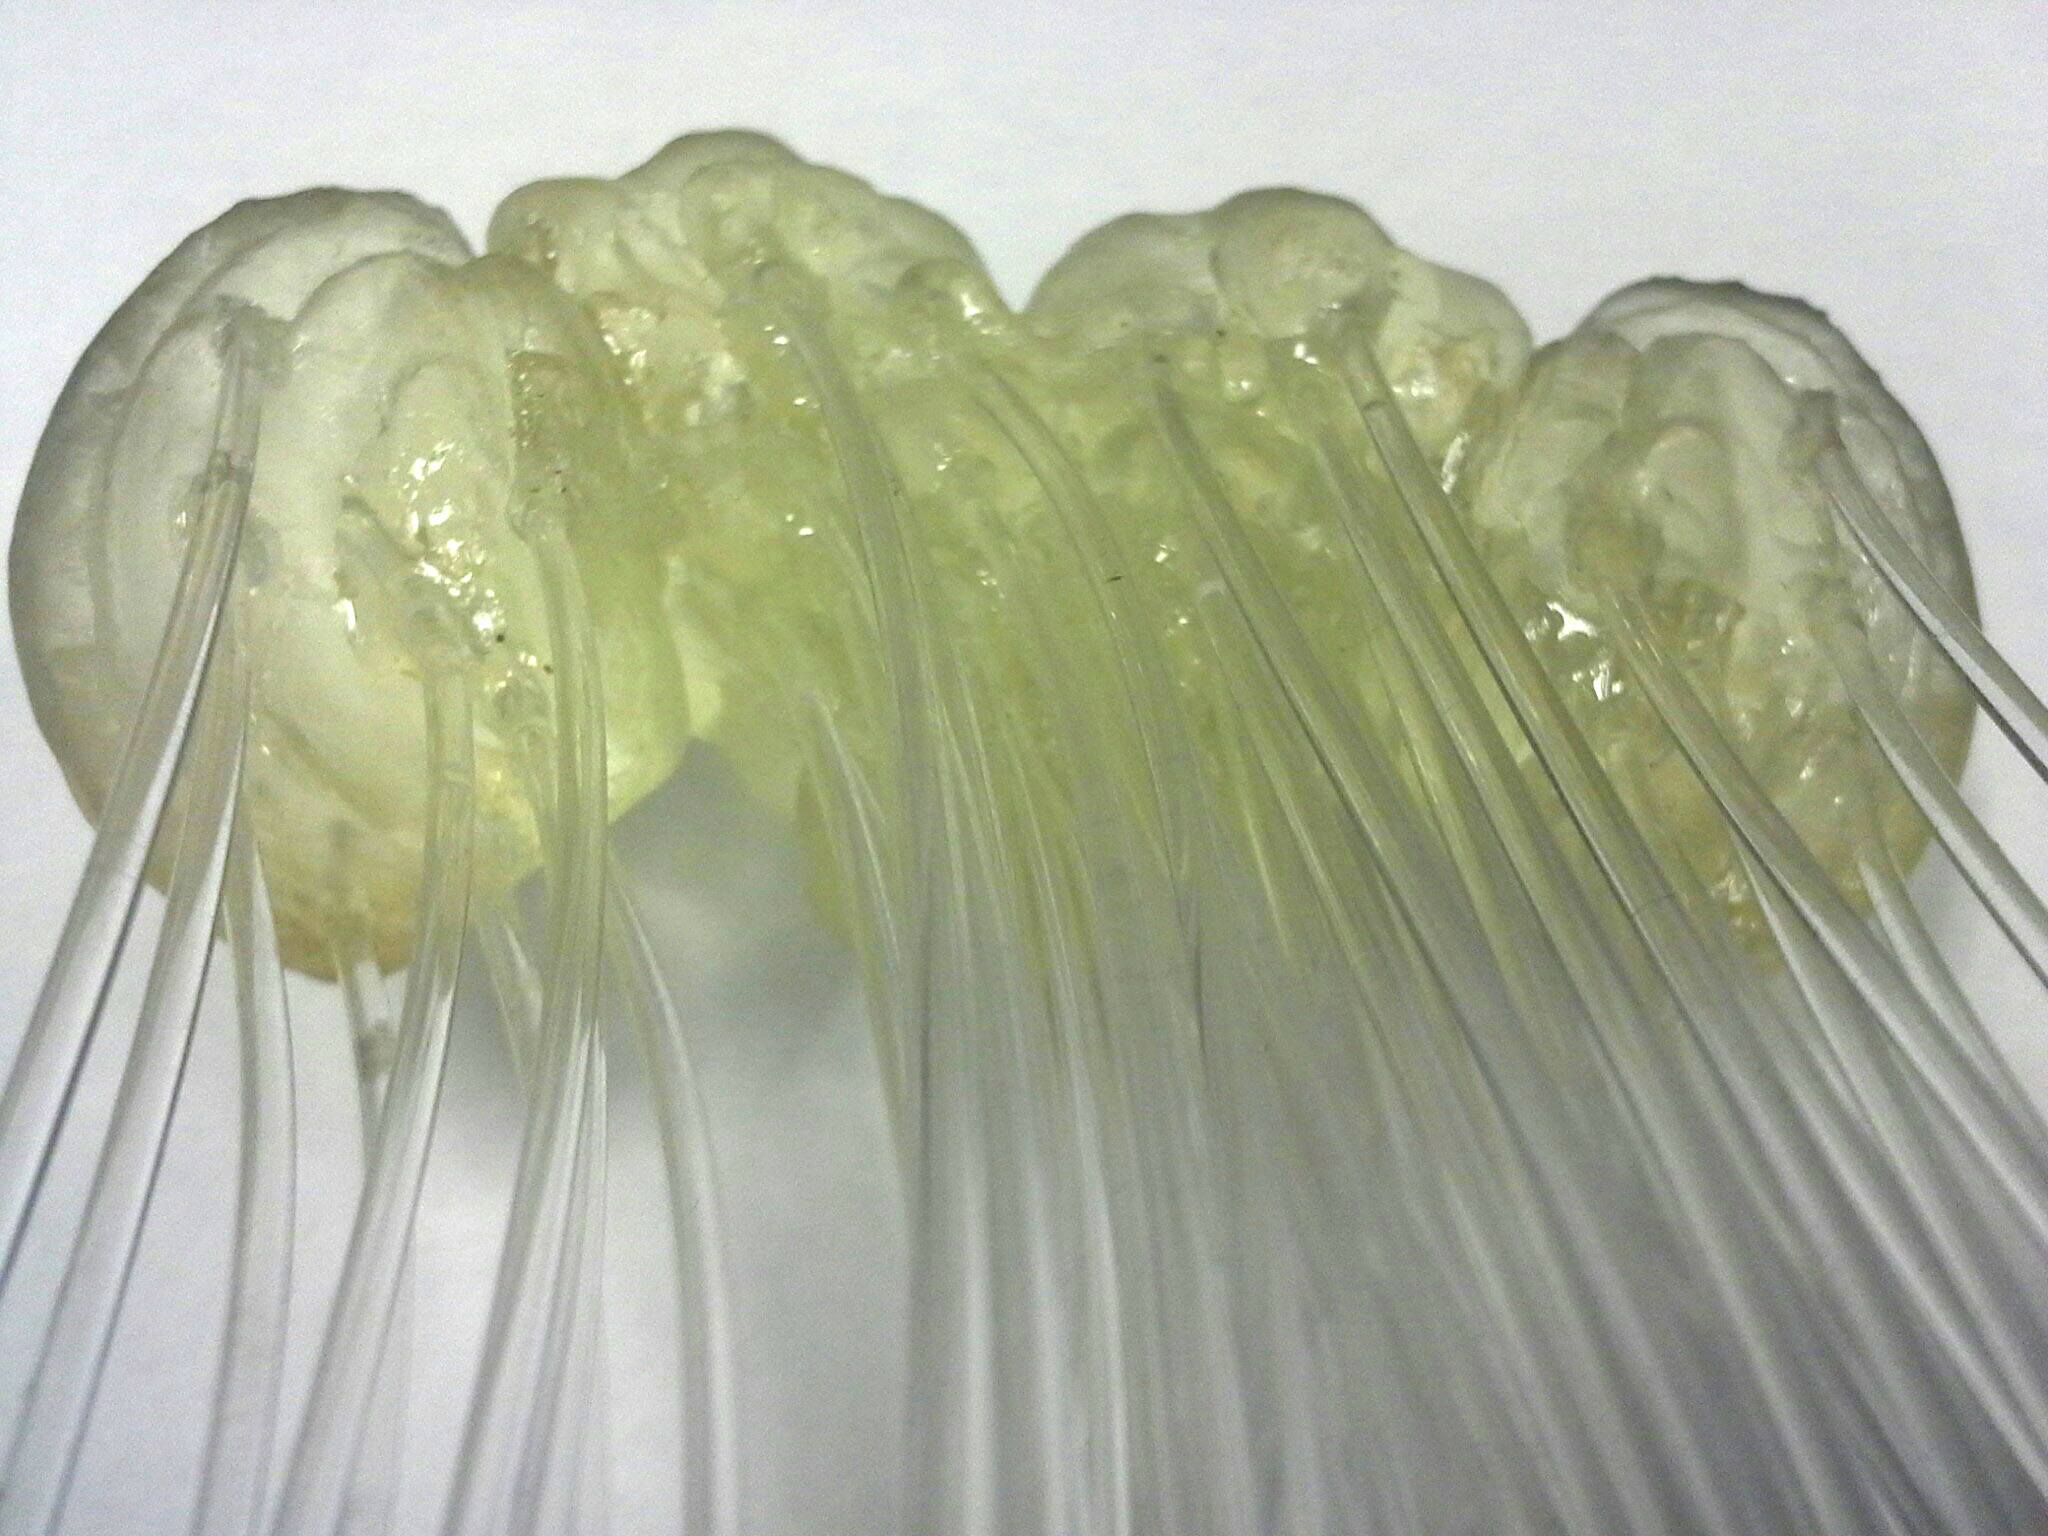
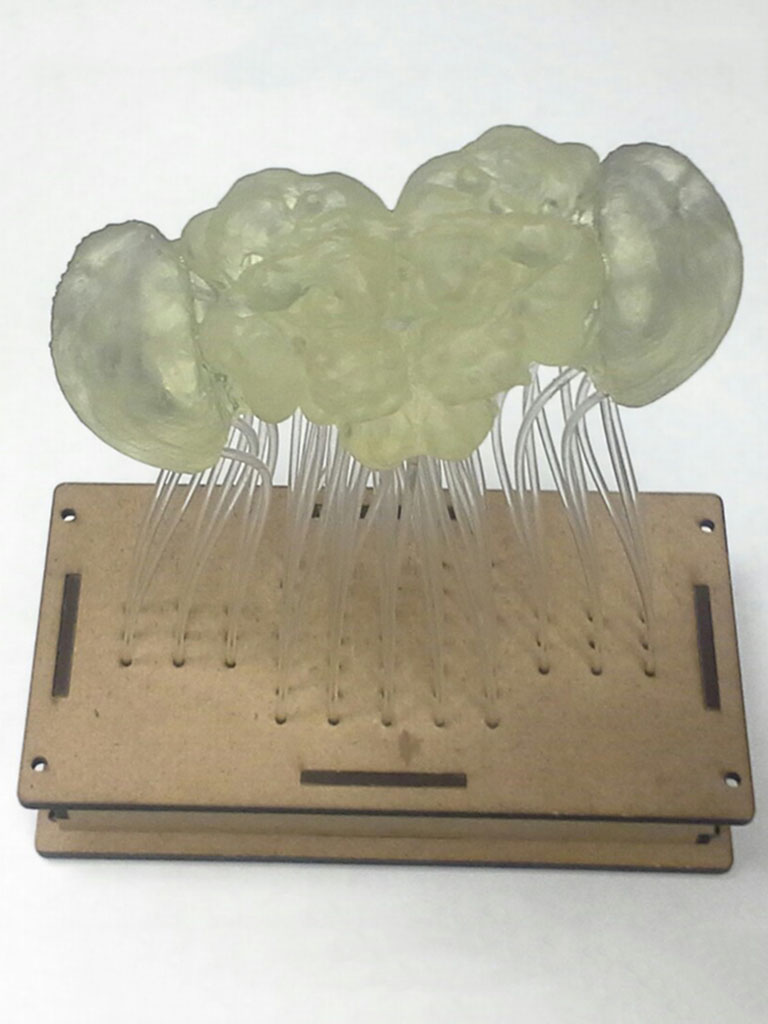
And here is the printed model and a close-up view of the back after glueing the fibers (2mm diameter unjacketed from FiberOpticProducts.com) using epoxy glue.
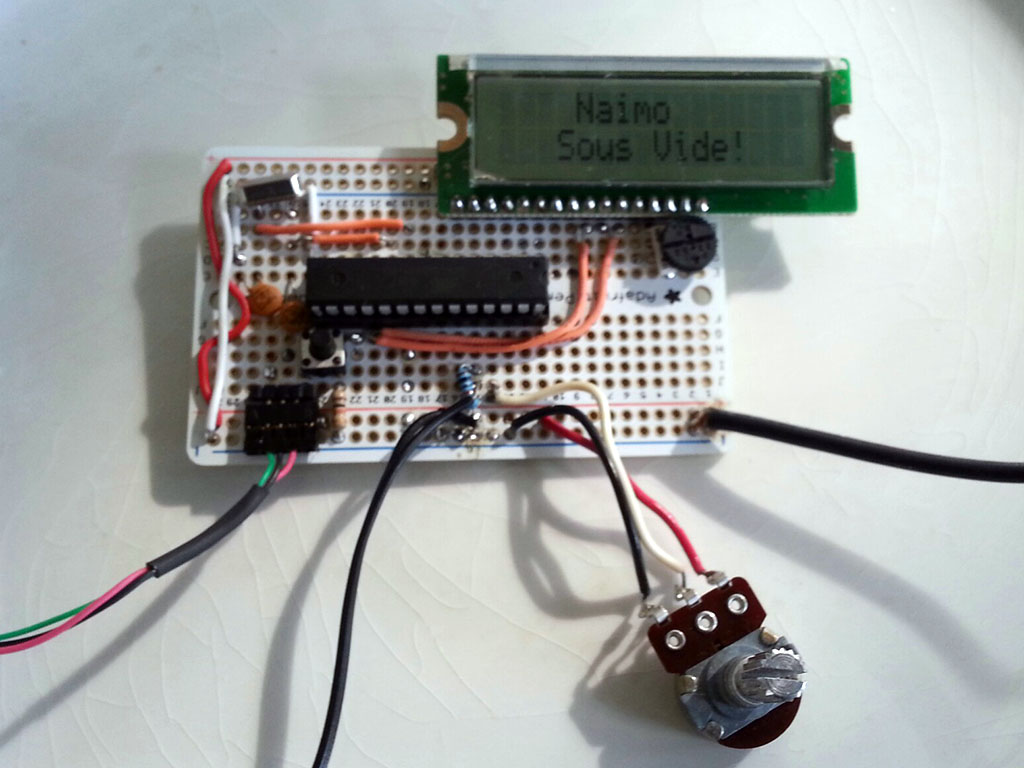
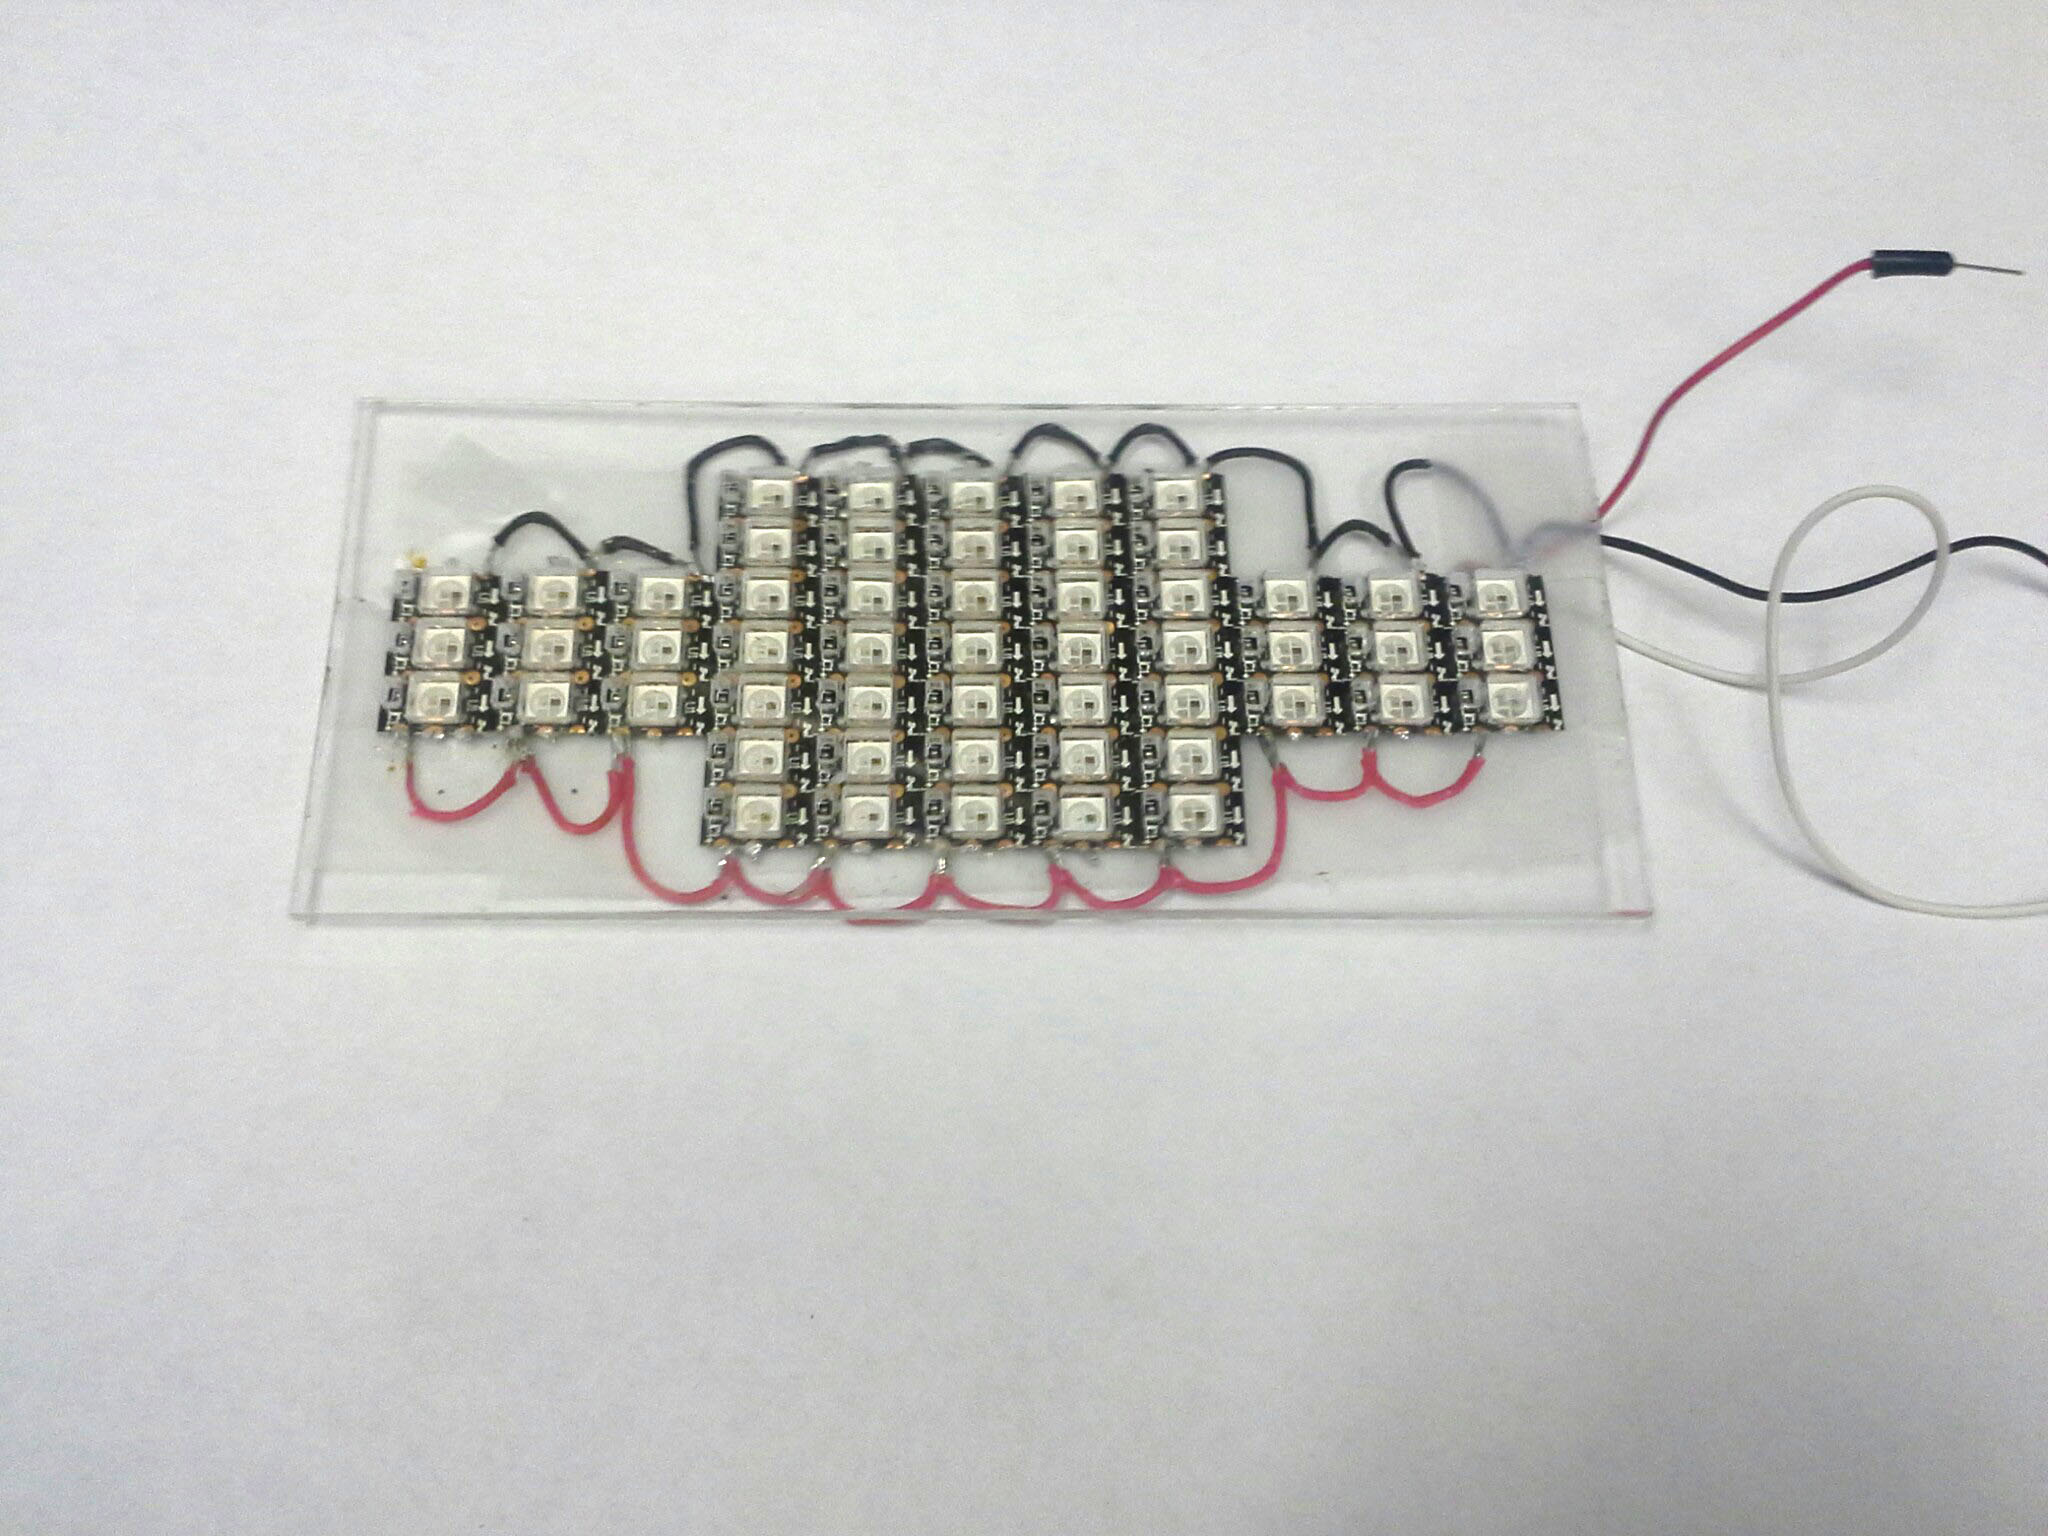
On the other end of the optical fibers, I needed LEDs to generate the light, ideally with the possibility to control the color too. I found Adafruit's Neopixels which come in different packagings. They are super convenient since you only need three wires (power and signal) to address a large number of these LEDs in series. I ordered a strip which, I think, gives the most flexibility in terms of cutting and soldering them in the desired shape and arrangement.
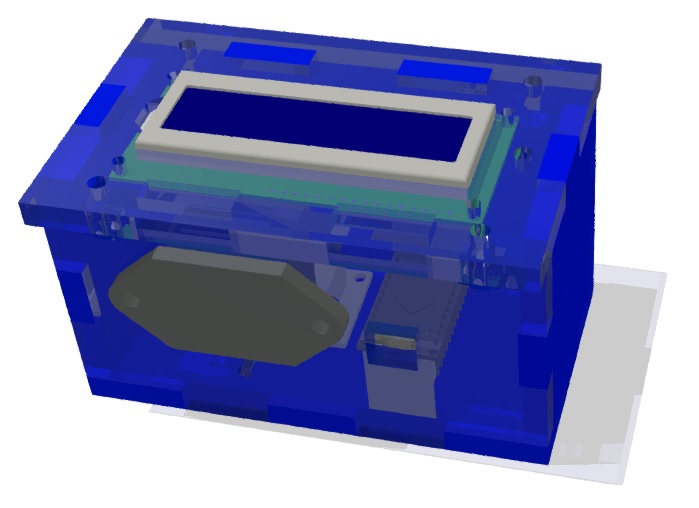
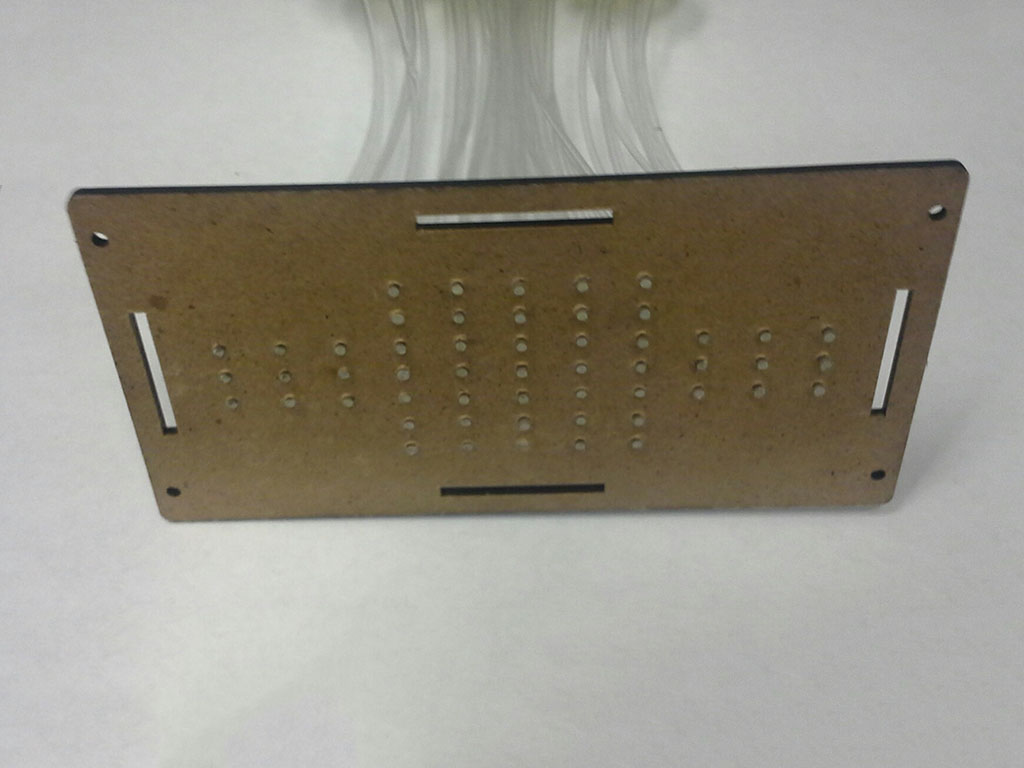
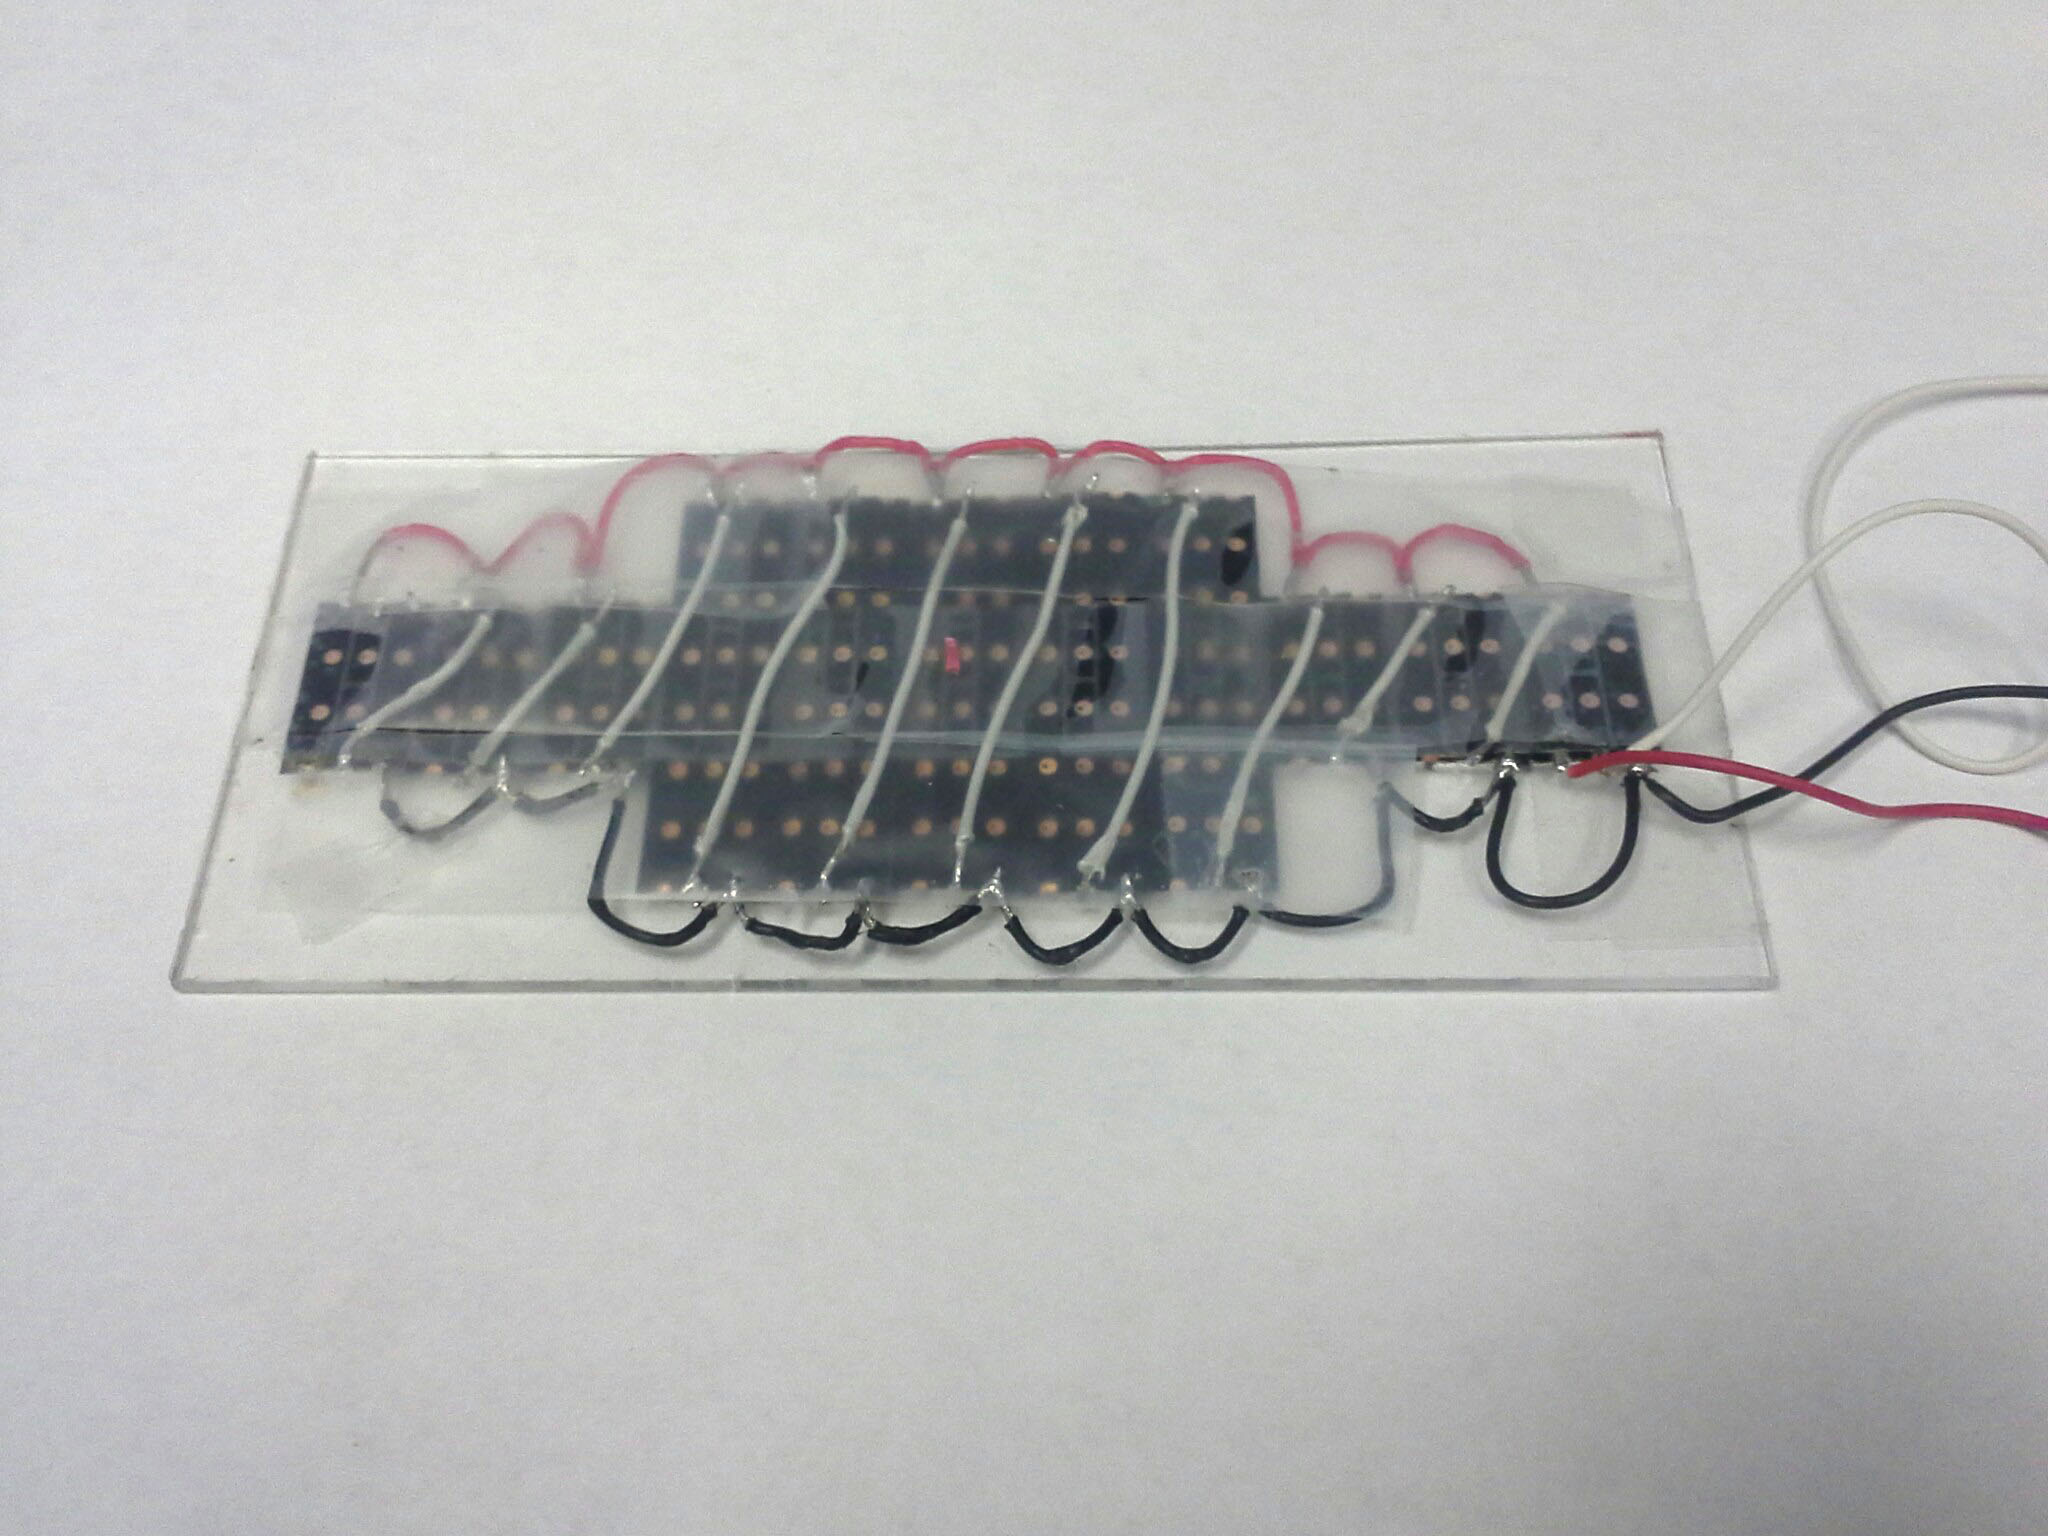
To couple the fibers with the LEDs and make sure that the alignment was perfect, I first laser-cut a hardboard box with regularly placed holes to hold the fibers in place. I then cut an acrylic sheet to the exact inner dimensions of the box, with small slots to perfectly fit the LED strips and hold them exactly below the optical fibers. Here is the result after soldering the LED strips to restore the 5V supply and the chain of signal.
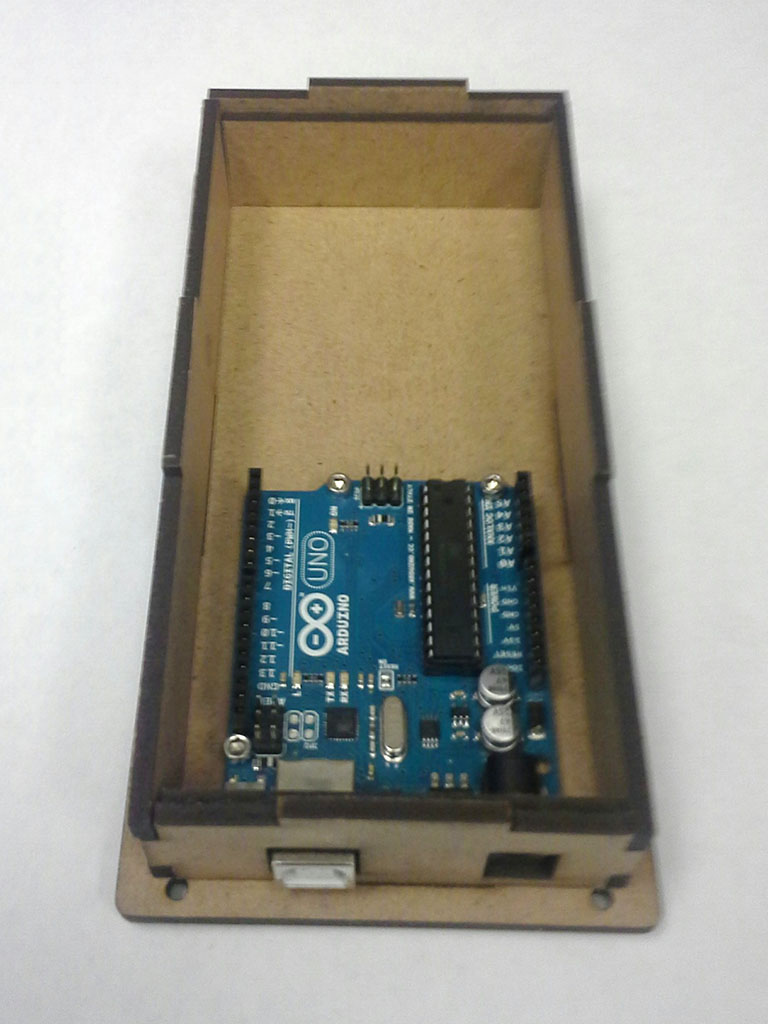
Otherwise the box is simply designed to hold the arduino in place, leaving an opening to access the USB port, and to conveniently snap together.
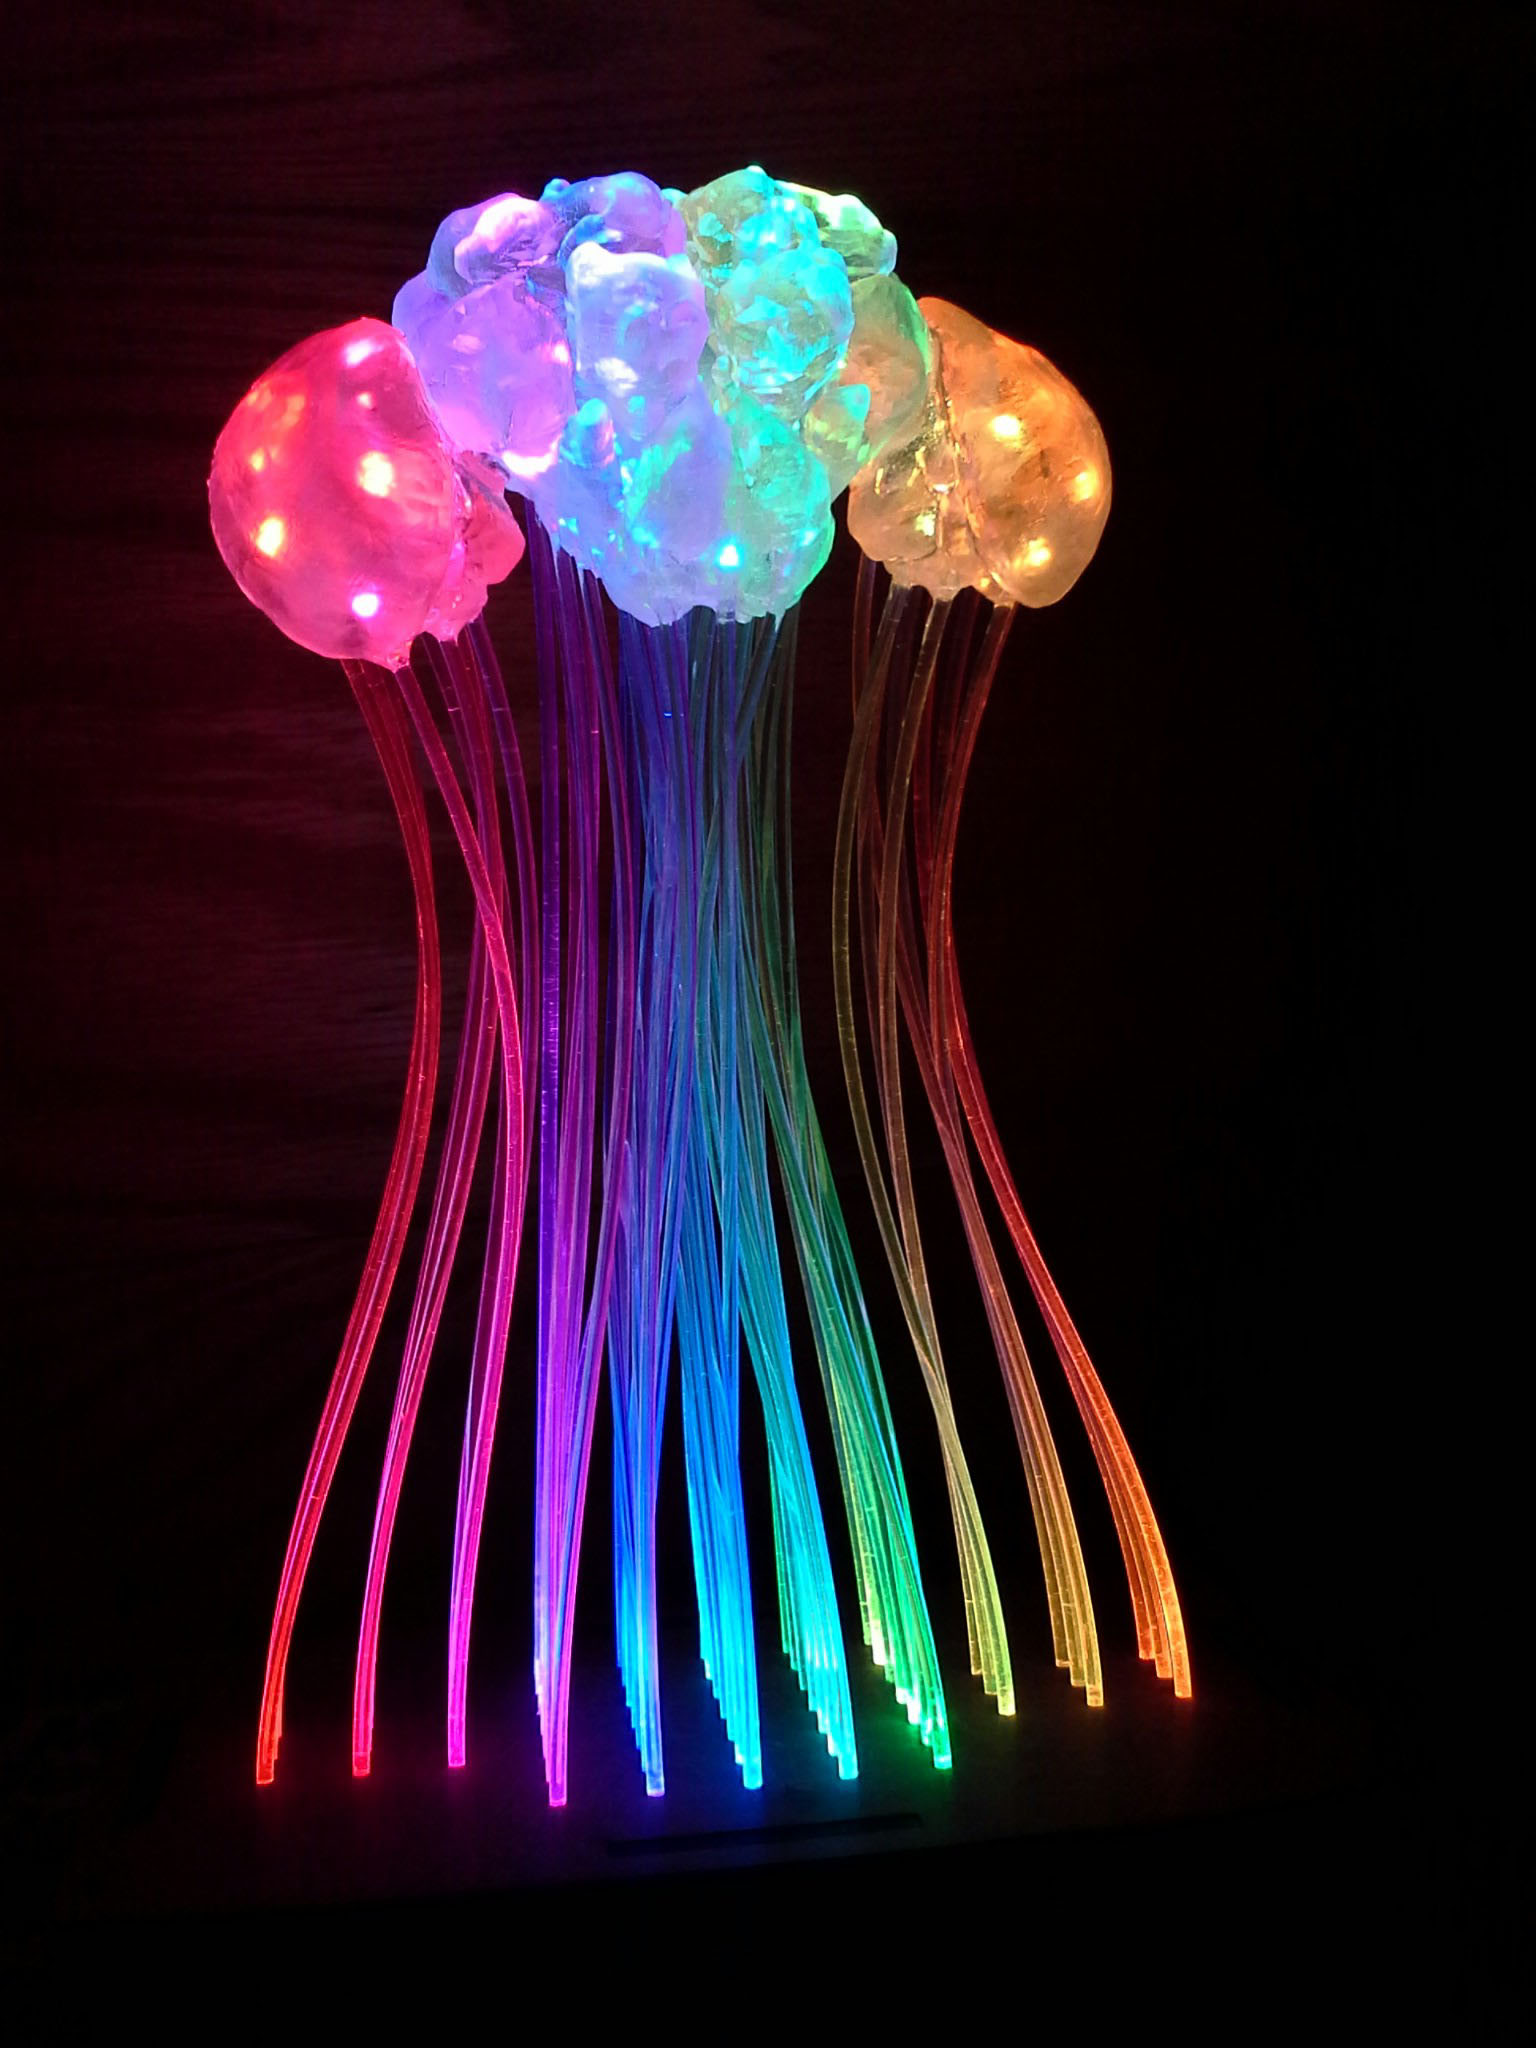
Beyond making a cool lamp, like in the top picture, I wanted to display scientific data masured on a real fly brain. To achieve this, the final piece of the puzzle is the code that converts the intensity information from the cartesian grid of the measured data to the position of the respective fibers. For a given LED, say, number n on the strip, I know the coordinates x(n), y(n) and z(n) of its end inside the model (they correspond to the centers of my spheres as described earlier). Even though these coordinates often do not coincide with a point of the initial data, I can calculate which intensity to display on that particular LED using a simple interpolation, in other words, by approximating its value using the nearest existing data points.
To verify that this interpolation worked as expected, that the orientation of the data matched that of the model, and that the fibers were placed in front of their corresponding LEDs, I fed the algorithm with fake data (on a cartesian grid) in which a simple intensity wave sweeps from left to right, bottom to top, and front to back. Needless to say, I was relieved to see the brain light up properly.
And here is what it looks like when it shows actual data measured on a live fruit fly.
Other projects